Dental Practice Management Solutions With Full Revenue Visibility
TransDontics gives dental owners a clear picture of what their practice produces, collects, and loses in between; tracking payer mix, provider productivity, and overhead ratios so every growth decision is driven by data, not instinct.
3 Ways Poor Practice Management Stalls Your Dental Practice
Most practices run on instinct and month-end reports, well enough to survive, badly enough to leave $40,000–$120,000 in recoverable revenue untouched annually. Eligibility denials show on aging reports. Undercoded claims surface in audits. But a drifting payer mix, flat provider production, or overhead creeping past benchmark never sends an alert. It simply compounds until someone asks the right questions with the right data.
Untracked production vs. collections means silent revenue leaks.
Unreviewed fee schedules leave money in payer networks.
Unbenched productivity produces no accountability, no growth.
Overhead monitored monthly as a percentage of collections, benchmarked against your specialty, and flagged early enough for leadership to act before margins compress.
Practice Performance Baseline & Benchmark Analysis
We establish your practice's baseline across production, collections, overhead, payer mix, and recall compliance; with industry benchmarks alongside every metric.
Provider & Staff Productivity Reporting
Provider production, collections, chair utilization, and treatment acceptance tracked weekly and reported monthly; so performance drift is caught before it becomes a problem.
Every performance metric your practice depends on to grow, tracked by one dedicated team and reported with the context your leadership team can act on.
Production vs. Collections Tracking
Daily production recorded, weekly trends established, and monthly production-to-collections ratio reported with cause and correction identified before divergence costs a quarter.
Payer Mix Analysis & Fee Schedule Review
Payer mix mapped by reimbursement tier, under-contracted plans flagged, and renegotiation opportunities prioritized; most practices discover 8–15% of net collections left in unreviewed fee schedules.
Provider Productivity Benchmarking
Production, collections, chair utilization, and new patient allocation tracked weekly against specialty benchmarks, drift identified with enough lead time to address before it becomes a performance conversation.
Overhead Ratio Management
Overhead tracked monthly as a percentage of collections, benchmarked against specialty norms, and flagged with expense-level context before margins compress.
Recall Compliance & Patient Retention Reporting
Recall compliance, active patient count, reactivation rate, and new patient acquisition tracked monthly because silent attrition shrinks your patient base faster than any denial report shows.
Appointment Utilization & Schedule Efficiency
Scheduled vs. actual production, no-show and cancellation rates, and unfilled chair time tracked so scheduling decisions are built on data, not staff intuition.
Treatment Plan Acceptance Analysis
Acceptance rate tracked by provider, case value, and procedure category, revealing which providers, plan sizes, and procedure types are leaving the most production on the table.
Strategic Growth Reporting & Advisory
Monthly performance report with prior-period comparison, trend direction, and prioritized focus areas with context and recommended response, not just numbers.
Who We Help
Customized billing solutions based on your specialty
Practice Performance Tracking Across Every Specialty and Every Code Range
We track production and collections by CDT code range; showing which procedure categories outperform, underperform, or are coded in ways that leave reimbursement on the table. When a category’s collection rate lags production, there’s a billing, coding, or contract explanation.
The RPA Advantage: Automation That Powers Practice-Wide Performance Visibility
Our RPA pulls production, scheduling, collections, and payer data from your PMS continuously; eliminating manual extraction and delivering reports before trends become problems. Automation handles the data. Our specialists handle the analysis.
Are you ready to combine AI speed with the persistence of human expertise? Start with a complimentary 12-month billing audit; no strings attached.
Benchmarks differ by state, market, and specialty. A strong collections rate in rural Mississippi is underperformance in metropolitan California. We apply the correct regional and specialty benchmarks to every practice because geography-blind guidance gives you a number to feel good about, not a target to grow toward.
TransDontics is not a clearinghouse or a claim-submission portal. We are your complete outsourced dental revenue cycle management department handling every step from eligibility verification to final payment posted to your ledger.
Eligibility Verification
Real-time insurance verification before every appointment, eliminating surprise denials and protecting your cash flow from day one.
Dental Billing and CDT Coding
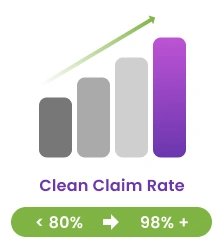
Expert CDT coding, clean claim submission, and aggressive denial management by specialty-certified billers. 98% first-pass clean claim rate.
A/R Management
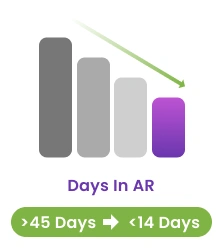
No claim goes 48 hours without follow-up. We pursue every outstanding balance across all payers until it is paid, appealed or written off.
Credentialing Services
Get in-network faster. We handle all payer paperwork, CAQH maintenance, renewals, and compliance tracking so you start seeing insured patients.
Dental RPA Automation
Robotic process automation eliminates manual repetitive tasks. Eligibility checks, reminders, and daily reports run without human intervention, 24/7.
Complete Dental RCM
Full revenue cycle coverage from patient registration to final payment. We manage all claims, close every gap, and maximize your collections.
Practice Management
Strategic oversight of your practice’s operational and financial performance. We track collections, payer mix, and productivity metrics
Front Office Management
Complete front office billing support covering patient billing inquiries, insurance comms, prior auth, and appointment-linked verification.
Transcription Services
HIPAA-compliant dental transcription delivered fast and accurately. Clinical notes, procedure documentation, and patient records are transcribed.
Dental Billing Audit
We review your last 12 months, find your top 3 revenue leaks, and show you exactly what we fix. Practices often discover recoverable revenue.
A transparent comparison of what a TransDontics billing audit delivers versus what a standard internal review actually finds.
Expenses
Production Tracking
Collections Rate Monitoring
Payer Mix Analysis
Fee Schedule Review
Overhead Management
Appointment Utilization
Treatment Acceptance Insights
Recall & Reactivation
Self-Managed or In-House
No mid-cycle correction possible
Collections reviewed quarterly
No payer mix visibility
Fees accepted as presented
Overhead not tracked promptly
Empty slots identified after the day is lost
No tracking for declined treatment
Recall managed ad hoc
Daily provider productivity reports
Real-time collections benchmarked
Monthly payer mix report
Payer fee schedules renegotiated
Overhead ratio tracked against collections
Schedule and chair time reported monthly
Acceptance rate tracked
All metrics monitored and reported
You Pay Nothing Until We Collect For You
No setup fees, no retainers, no contracts; we earn only on what we collect. Practice management reporting, payer mix analysis, and productivity tracking are included in our RCM service, not billed separately. Most practices recover the equivalent of a full consulting engagement per quarter within the first year.
TransDontics Provides Coverage Across All Dental Payors
Whatever dental insurance you accept, we’ve got you covered. Transdontics billing experts navigate every major dental insurance network with 15+ years of payor expertise.
Frequently Ask Questions
What does dental practice management actually cover?
Practice management covers production vs. collections tracking, payer mix analysis, fee schedule benchmarking, provider productivity reporting, overhead ratio management, recall compliance, and treatment acceptance tracking — managed with current data and specialty-specific benchmarks so every decision is driven by evidence, not instinct.
How is professional practice management different from hiring a dental practice consultant?
Consultants engage periodically using exported reports; by the time a problem surfaces, it’s been compounding for months. TransDontics is continuous and integrated, working inside your PMS and RCM simultaneously, identifying performance trends in the current reporting cycle before the damage is done.
How does TransDontics approach payer mix analysis and fee schedule renegotiation?
We map every plan in your schedule, benchmark effective reimbursement rates against regional specialty norms, and prioritize under-contracted plans for renegotiation. Most practices not reviewed in three-plus years discover they’re leaving 8–15% of net collections unclaimed in under-contracted plan relationships.
How does TransDontics track provider productivity, and what benchmarks are used?
Provider productivity is tracked weekly at the individual level; production per day, collections by provider, chair utilization, and treatment acceptance rates, benchmarked against specialty-specific targets, not generic dental averages, with performance drift identified and connected to its operational cause.
How does overhead ratio management work within TransDontics practice management?
We track overhead as a percentage of collections monthly, benchmarked against specialty norms. When ratios trend toward the upper boundary, we flag the specific expense categories driving movement, staff costs, lab fees, supplies, before the threshold is crossed, not after.
Can TransDontics manage practice performance reporting for multi-location dental groups?
Yes. We track production, collections, productivity, overhead, and payer mix at both location and group level; identifying which locations are moving group metrics in either direction, with fee schedule benchmarking performed at the individual market level for maximum reimbursement.
Does TransDontics work directly inside our practice management software for reporting?
Yes. We work natively inside your existing PMS, no exports, no parallel dashboards, no additional software. Live data from Dentrix, Eaglesoft, Open Dental, Curve, DentiMax, Carestream, iDentalSoft, and all major platforms feeds every monthly performance report we deliver.
Is dental practice management through TransDontics HIPAA compliant?
Yes. TransDontics is HIPAA-certified, ISO 27001 certified, and SOC 2 Type II compliant. Every practice receives a signed BAA before data access begins. All access is role-controlled, activity-logged, and encrypted; governed by the same security protocols applied across our complete RCM operations.
Specific, verified outcomes, not generic praise. Every metric sourced from client data.
In the first 60 days, TransDontics recovered $18,400 in claims our team had written off as uncollectable. They caught 47 denied claims we had given up on. The Dentrix integration was seamless as they were billing the same day.
Dr. Amanda Lewis, DDS
General Dentist · Austin, TX
I was spending 3 hours a day chasing orthodontic claims. TransDontics took over and our denial rate dropped from 22% to under 4% in three months. The multi-visit treatment plan billing alone recovered $31K we had been losing annually.
Dr. Rachel Kim, DMD
Orthodontist · Los Angeles, CA
We run 3 oral surgery locations on Eaglesoft. The OMS anesthesia cross-coding was a mess; TransDontics cleaned it up in week one. Collections are up 11% across all three locations.
Dr. Marcus Peters, DMD MD
Oral Surgeon · Dallas, TX
Ready to Find Out Exactly What Your Practice Is Owed?
Join 500+ dental practices that trust TransDontics to track their production, monitor their payer mix, benchmark their providers, and deliver the strategic reporting their leadership teams need to make decisions that grow revenue with intention. Start with a free practice performance audit and find out exactly where your current numbers are leaving money behind.